


These 4 Companies Are Profiting from Warehouse Automation

High labor costs and shortages, pressure to speed up shipping, and the growth of e-commerce are driving more and more companies to automate their warehouses. But suppliers do not all profit equally. Some sell entire robotic systems, others sell equipment along with consumables and service, and still others build projects across industries. Which model has the best economics, and what has the market already priced in?
Key points
The long-term need for automation does not translate evenly into supplier revenue. Industry orders fell by 3% in 2024, and only modest, more broadly distributed growth is expected in 2026.
A large order book alone does not guarantee high profits. What matters is the margin at which orders are delivered and the bargaining power of the largest customers.
The industry’s best economics come from recurring revenue from consumables, service, and software combined with low capital intensity—not from selling robots.
Diversified suppliers are less sensitive to the warehouse cycle than their marketing suggests, and some major players in the sector’s hardware segment have exited in recent years.
The highest-quality company, the fastest-growing company, and the most attractively valued stock may not be one and the same. Valuations for fast growth often assume a pace that the industry itself will not deliver.
Why warehouse automation is an investment theme
Warehouse automation is often presented as a one-way trend: labor is getting more expensive, e-commerce is growing, and robots are replacing people. For investors, the more important question is who actually profits from this trend and under what conditions. A supplier of a robotic system worth hundreds of millions of dollars bears execution risk; a supplier of barcode scanners sells repeatedly and in large volumes; and a Japanese systems integrator balances projects across warehouses, chip factories, and airports. All three models belong to the same theme, yet they have different profitability, cycle sensitivity, and valuations.
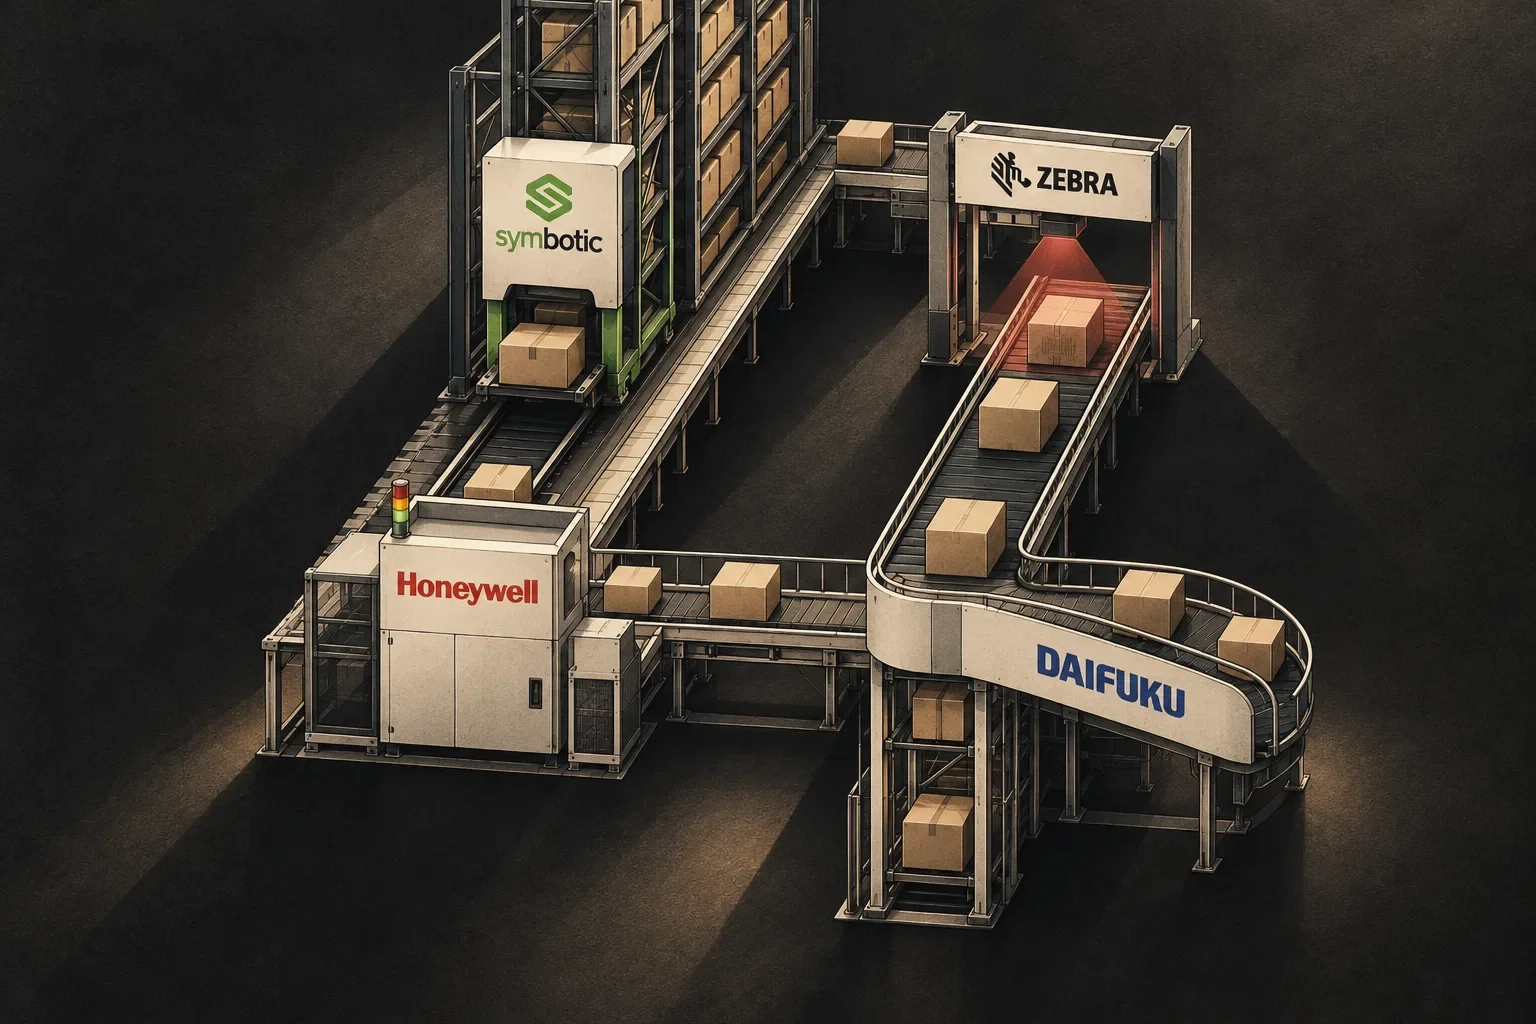
Symbotic $SYM, Zebra $ZBRA, Daifuku $6383.T, and Honeywell $HON are therefore not direct competitors. Symbotic automates entire distribution centers, Zebra digitizes workers’ tasks and the movement of goods, Daifuku builds material-handling systems across industries, and Honeywell has decided to exit the sector’s hardware segment. A company’s position in the value chain determines its margins as well as how much investors are willing to pay for its shares.
How warehouse automation economics work
When automation pays off
At its core, a customer’s decision comes down to calculating the payback period. The biggest savings typically come from labor costs, with better use of space, fewer errors, and the ability to handle peak periods without hiring temporary workers also contributing. Investments in packaging machines typically pay back within one to two years, while complex, fully automated warehouses often take more than five years. Warehouse management software (WMS) can pay for itself in 6 to 12 months, mechanized solutions in one to two years, and semi-automated systems in three to four years.
This points to a fundamental difference between suppliers. Inexpensive solutions with a quick payback, such as scanners, mobile terminals, or software, continue to sell even in tougher times. Large projects with a payback period of over five years require customers to believe their volumes will grow and to have access to low-cost capital. Automation is economically more attractive than human labor especially when wages are high, volumes are consistently high, land is expensive, and a warehouse is expected to operate for a long time.
Need is not the same as budget
The long-term need for automation does not translate evenly into supplier revenue. Global orders for warehouse automation fell by 3% in 2024 because of high interest rates and a surplus of warehouses built during the pandemic. In 2025, orders exceeded expectations, but growth was driven by just a few large retailers, such as Amazon, Tesco, and Marks & Spencer. For 2026, more broadly distributed but only modest growth is expected among most suppliers, while the impact of new warehouse construction is not expected until 2027. Over the long term, orders are projected to grow by an average of around 8% annually from 2024 to 2030. This figure measures system orders received, not supplier profits.
For supplier stocks, this leads to a simple test: industry growth of a few percent a year is not enough to justify valuations that assume growth of tens of percent. That kind of growth must come from gaining market share, entering new segments, or landing one extraordinary customer—which is precisely the case with Symbotic.
Symbotic
Business model
Symbotic supplies complete robotic systems for distribution centers: autonomous bots (SymBots), high-density storage racking, robotic palletizers, and software that manages the flow of cartons from receiving to shipping. Customers pay not for individual machines but for a complete system deployed in a specific building. Of the $720.8 million in revenue in fiscal Q3 2026 (through June 27, 2026), $671 million (93%) came from systems, $12.8 million from software maintenance and support, and $37.1 million from operations services. Recurring revenue therefore accounts for about 7% of sales.
Customer concentration is crucial. In fiscal 2025, roughly 85% of revenue came from Walmart $WMT. In January 2025, Symbotic acquired Walmart’s Advanced Systems and Robotics division and signed a framework agreement to automate pickup locations inside stores. Its other major customer is the joint venture with SoftBank, GreenBox, now operating as Exol. These two agreements make up most of the $22.5 billion order book (backlog).
Financial results and their quality
Revenue: $1.18 billion (FY2023), $1.79 billion (FY2024), $2.25 billion (FY2025, +26%), and $720.8 million in fiscal Q3 2026 (+22% year over year). The fiscal year ends in September.
Gross margin: 22.3% under US GAAP and 25.0% on an adjusted basis in Q3 2026, compared with 18.9% and 21.5% a year earlier.
Operating profit: $32.9 million in Q3 2026, a margin of 4.6%. Just $45.5 million for the first nine months. The company reported a net loss of $91 million in FY2025.
Net income of $55 million in Q3 2026 includes $19.4 million from revaluing strategic investments and $11.3 million in interest income. Only $11.7 million was attributable to Class A shareholders, with the remainder going to non-controlling interests.
Stock-based compensation: $50.5 million in Q3 2026 and $151.8 million for the first nine months—more than three times operating profit over the same period.
Free cash flow looks excellent at first glance. In FY2025, operating cash flow reached $866.9 million, but $606 million of that came from an increase in deferred revenue, or customer prepayments. In fiscal Q3 2026, free cash flow was negative (-$164.6 million) because prepayments fell by $123.8 million and receivables increased by $155.9 million. It totaled +$242.8 million for the first nine months. Symbotic’s cash position therefore depends more on the timing of payments from Walmart and GreenBox than on margins. In fiscal 2026, the company also raised $424 million by issuing Class A shares.
Competitive advantage
Symbotic’s advantage is evidenced primarily by its exclusive relationship with Walmart and the fact that its system is deeply embedded in the building. Switching suppliers would mean rebuilding the warehouse, so retention is very high after installation. On the other hand, a 4.6% margin does not yet demonstrate pricing power: a customer accounting for more than 80% of revenue has strong bargaining power. The acquisitions of ARMS Innovations (July 2026) and cellumation (October 2026) expand its software and sorting technologies, but their contribution is not yet visible in the results.
Main risks
Risk | Cause | Impact | Signal |
|---|---|---|---|
Customer concentration | Walmart accounts for roughly 85% of revenue | A slowdown in rollouts would immediately reduce revenue | Walmart’s share in the 10-K, new contracts |
Project execution | 77 systems under construction at the same time | Lower gross margin, delayed revenue | Number of systems commissioned |
Cash flow quality | Dependence on prepayments | Negative FCF when prepayments are drawn down | Deferred revenue, receivables |
Shareholder dilution | Stock-based compensation and share issuance | Lower earnings per share | Stock-based compensation relative to EBITDA |